
“Great overview of finances for college, private school, and the future — really valuable information.”

This article was updated on February 21, 2020. It was originally published on February 18, 2016. The Student Aid Report (SAR) is a confusing government-type report that summarizes the information…

This article was originally published on March 16, 2013. It was updated on June 20, 2019. One of the biggest problems in planning to pay for college is that most…

Question: We are starting an account to eventually fund our child’s education, and we have heard that the 529 Savings Plan and the Prepaid College Tuition Plan are the two…

If you are a high school senior who will attend college in the fall, you need to understand the pressure and burden that follows when you take out massive student…
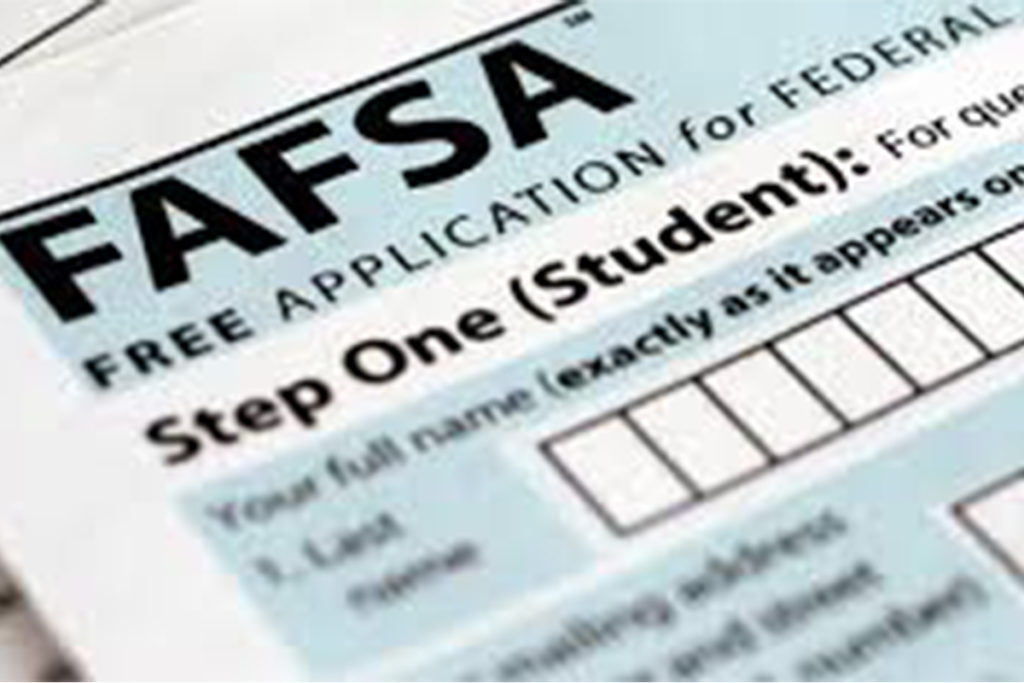
It’s almost time to apply for financial aid! Did you know the dates for the FAFSA® have changed? For those who will go to school beginning 2017-2018, students can fill…

As the cost of college heads for the stratosphere and student loans become more costly due to higher interest rates, many families may find themselves a bit cash-strapped and begin…

ROANOKE (WSLS 10) – The average cost of college can top $20,000 a year when you add in room and board. Families all over the country are trying to save…

Choosing a career path is one of the most important decisions that students face today. Lack of planning can force students into a five or six-year college degree. Students who…

Every year the cost of college seems to outpace the rate of inflation. You would think that our weak economy would have an effect on college prices, but it…